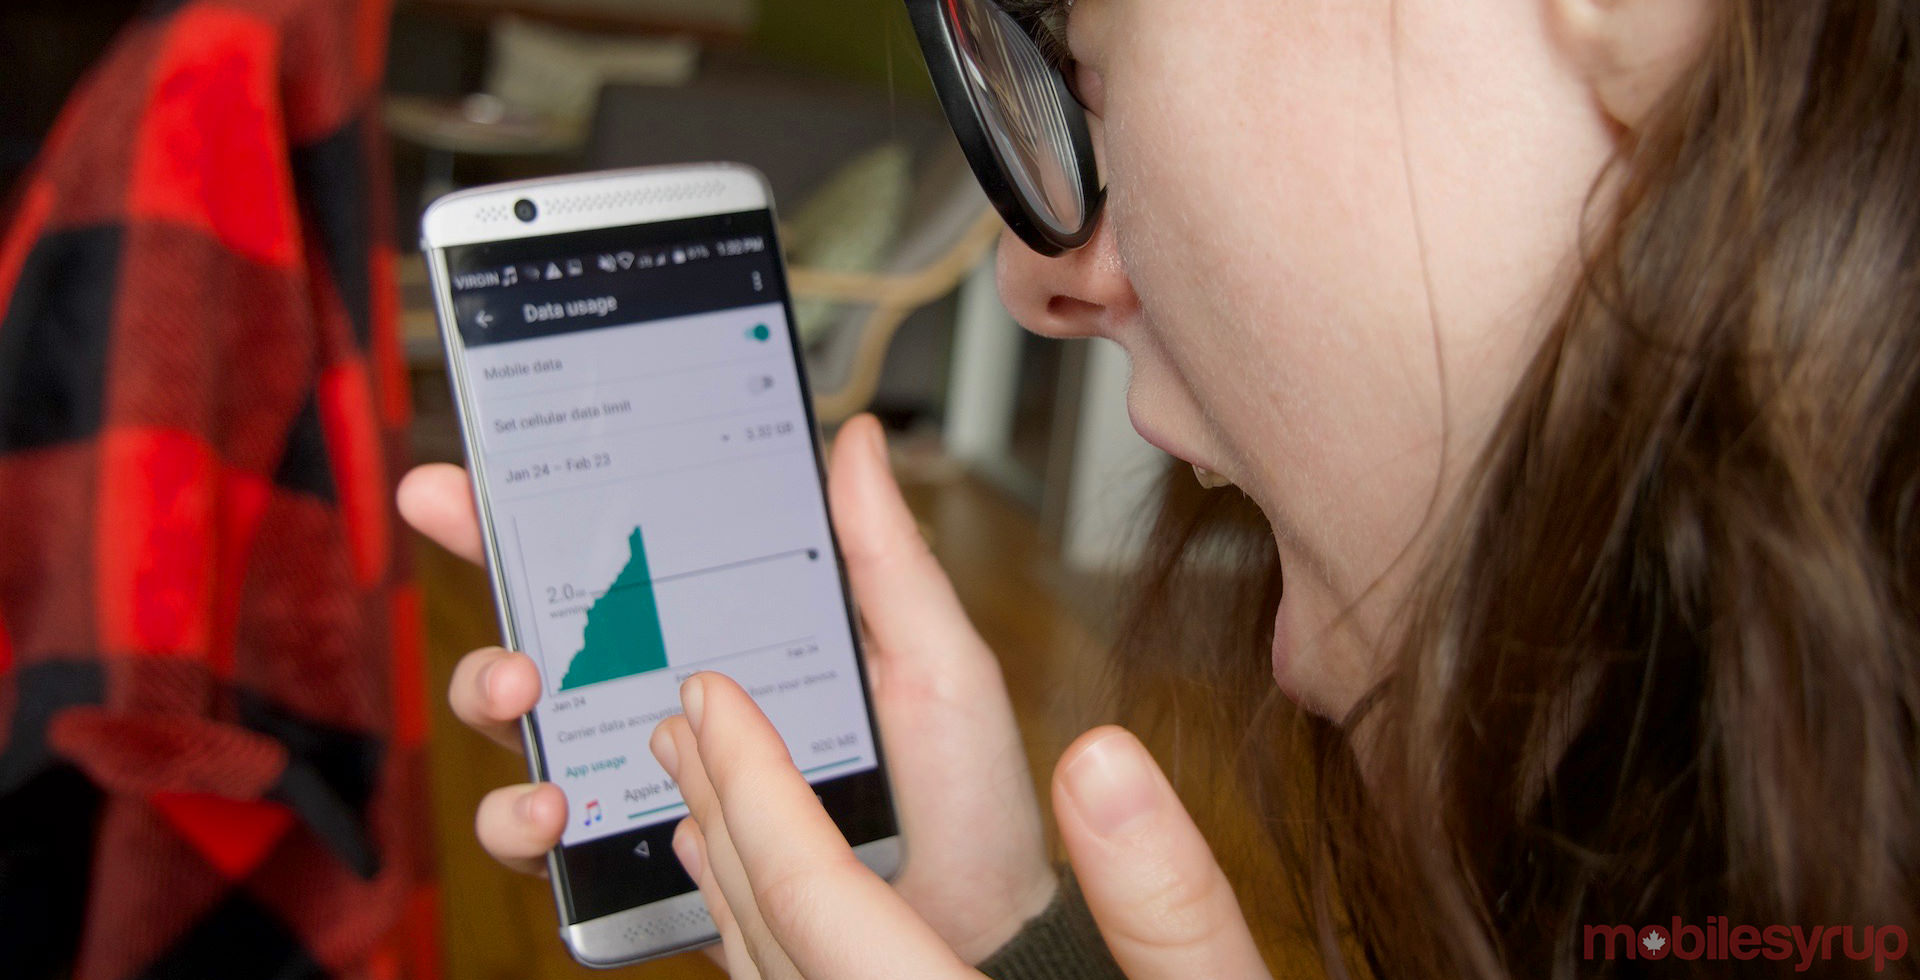
The year-over-year growth of mobile device usage slowed down in 2017, according to a new report from analytics firm Flurry.
In 2017, Flurry measured overall session app activity growth of six percent, down from 11 percent in 2016.
It’s important to note that Flurry is considering all of the 2.6 billion mobile devices it says are on the market, not just smartphones.
That said, Flurry says people spend more than fives hour a day on their smartphones, alternating between new and old app experiences, as opposed to spending more time on few titles.
Shopping app usage grew the most in 2017, making up 54 percent of sessions. Music, media and entertainment followed with 43 percent of sessions and business and finance placed third with 33 percent of sessions. Meanwhile, sports, photography and personalization-related apps all dropped eight percent each.
In terms of smartphone manufacturers, Flurry reports that the number of active iPhones rose to 37 percent in 2017, up three percent from the year prior. Samsung’s phones, meanwhile, held a 28 percent activity in both 2016 and 2017.
Interestingly, overall ‘phablet’ usage increased in 2017, likely due to the release of larger-screen phones like Samsung’s Galaxy S8+ and Galaxy Note 8 and Apple’s iPhone 8 Plus and iPhone X. Flurry notes that phablet usage rose to 55 percent in 2017, up from 41 percent in 2016.
Usage of medium-sized phones also fell accordingly and came in at 35 percent, down from 44 percent the previous year.
Did your mobile device usage change at all last year, and if so, why do you think it did? Let us know in the comments.
Source: Flurry
MobileSyrup may earn a commission from purchases made via our links, which helps fund the journalism we provide free on our website. These links do not influence our editorial content. Support us here.


