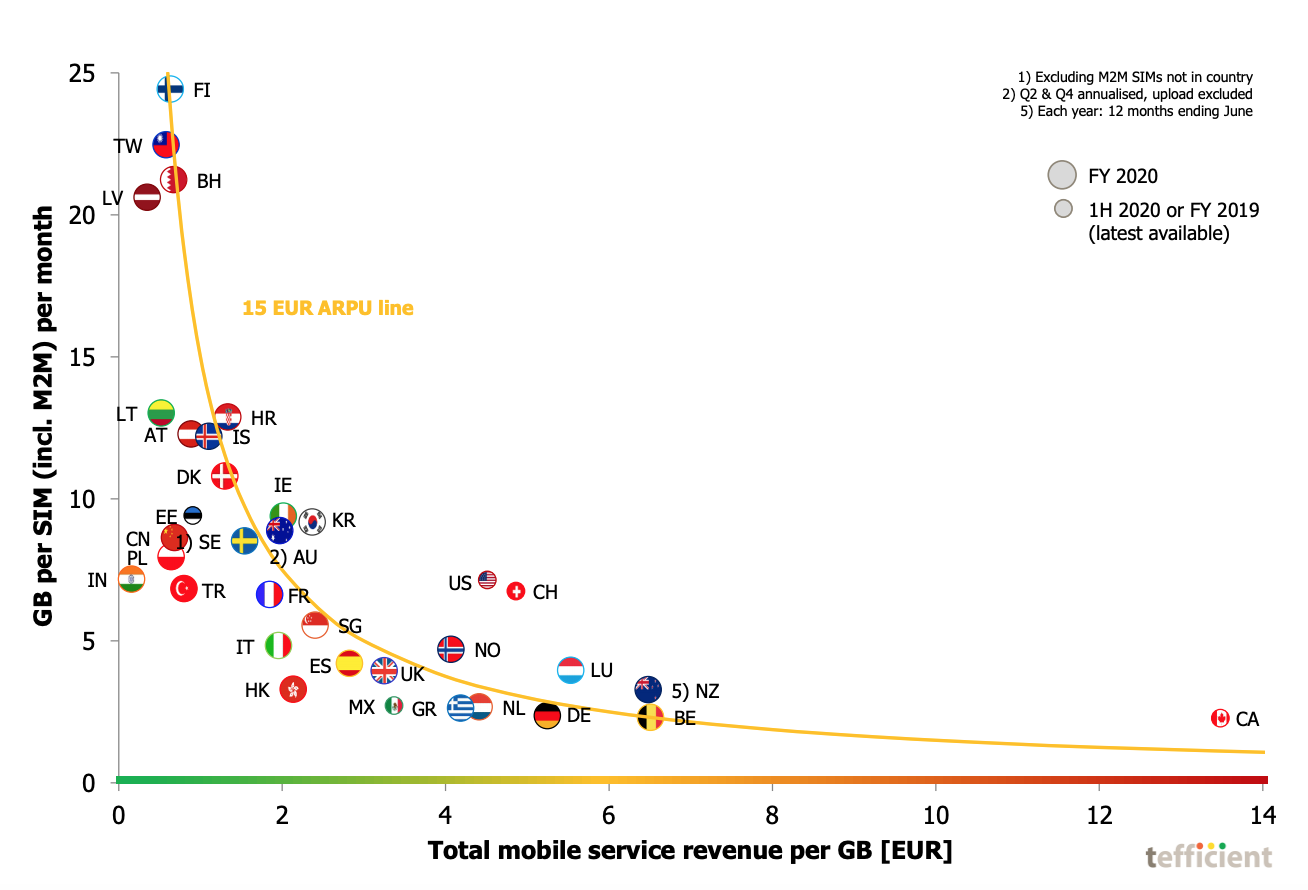
Canadian operators have the highest total revenue per GB when compared to other countries, according to analytics firm Tefficient’s latest report.
The report outlines that “there are a few countries where operators enjoy very high total revenue per consumed GB: Canada foremost, but also the cluster of Belgium, New Zealand, Luxembourg and Germany.”
Further, the firm outlines that it’s important to recognize that its analysis looks at what the mobile operators make on end-users, not what the best offer on the market currently is.
It’s worth noting that the data used for Canadian operators is from 2019 and not 2020.
Tefficient explains that “in reality, most users are on old price plans because they are still locked in by a contract, or because they have not bothered to find the best deal.”
In terms of the other side of the scale, Indian operators have the lowest total revenue per GB. Operators in Latvia, Lithuania, Taiwan, Finland, Bahrain, China and Portugal get the lowest revenue per consumed GB.
The report also found that Canada, the United States and Switzerland are among the countries where mobile carriers obtain ABPU (average revenue per user) much higher than elsewhere in the world.
Tefficient notes that “in all these markets, regulators have not yet reported 2020 data so the dots are for 2019. 2020 data would likely not have changed the outlier position of these markets as we continuously over the years have seen that operators in these markets enjoy high ARPU even though mobile data usage isn’t very high.”
The report notes that operators in Finland, Taiwan, Latvia, Lithuania, Bahrain and India are being “the most generous” with mobile data considering their ARPU.
Canada is also among the countries with the lowest data usage alongside Portugal, Belgium, Germany and Greece.
Further, the firm reiterates that “low usage doesn’t necessarily mean low ARPU, though. Market ARPU is uncorrelated with usage. Switzerland, USA and Canada have much higher ARPU than other countries in our analysis.”
Tefficient compiles its reports by collecting data from 44 different telecom regulators. It collects data regarding mobile data traffic, the number of mobile subscriptions and mobile service revenue.
Based on this data, the firm calculates a number of key performance indicators (KPIs) such as average data usage per month per subscription, total revenue per consumed GB and total revenue per subscription per month.
Image credit: Tefficient
MobileSyrup may earn a commission from purchases made via our links, which helps fund the journalism we provide free on our website. These links do not influence our editorial content. Support us here.


