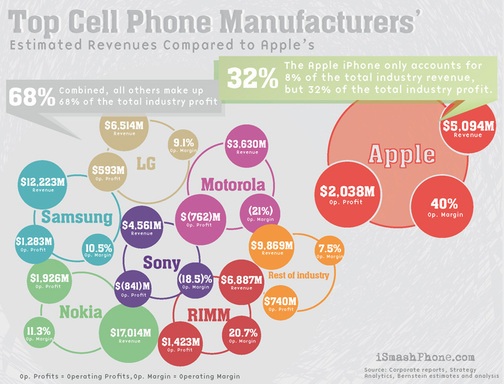
 There is a new chart that has been developed by iSmashphone that shows how much of a market Apple now has. All statistics were gathered by Q2 earning from all the major cellphone manufacturers: Apple LG, Motorola, Sony Ericsson, RIM, Nokia and Samsung.
It’s certainly interesting to look at, very colourful and at the very least it shows how dominant the Apple iPhone truly is. They state “The cell phone handset industry has sold over $65B in the last 6 months. Of that, 9.7% was pocketed by the companies. It was recently announced that Apple received 32% of the total handset market’s profits, equivalent to a whopping $2,038,000,000, all from selling the iPhone. Prior to paying expenses, the net revenue Apple earned from the iPhone is over 5 billion dollars. These figures astounded us, so we did a little more research. The graphic below visualizes what these numbers actually mean by comparing operating profits, operating margins, and net revenues.”
Via: Gizmodo
MobileSyrup may earn a commission from purchases made via our links, which helps fund the journalism we provide free on our website. These links do not influence our editorial content. Support us here.


