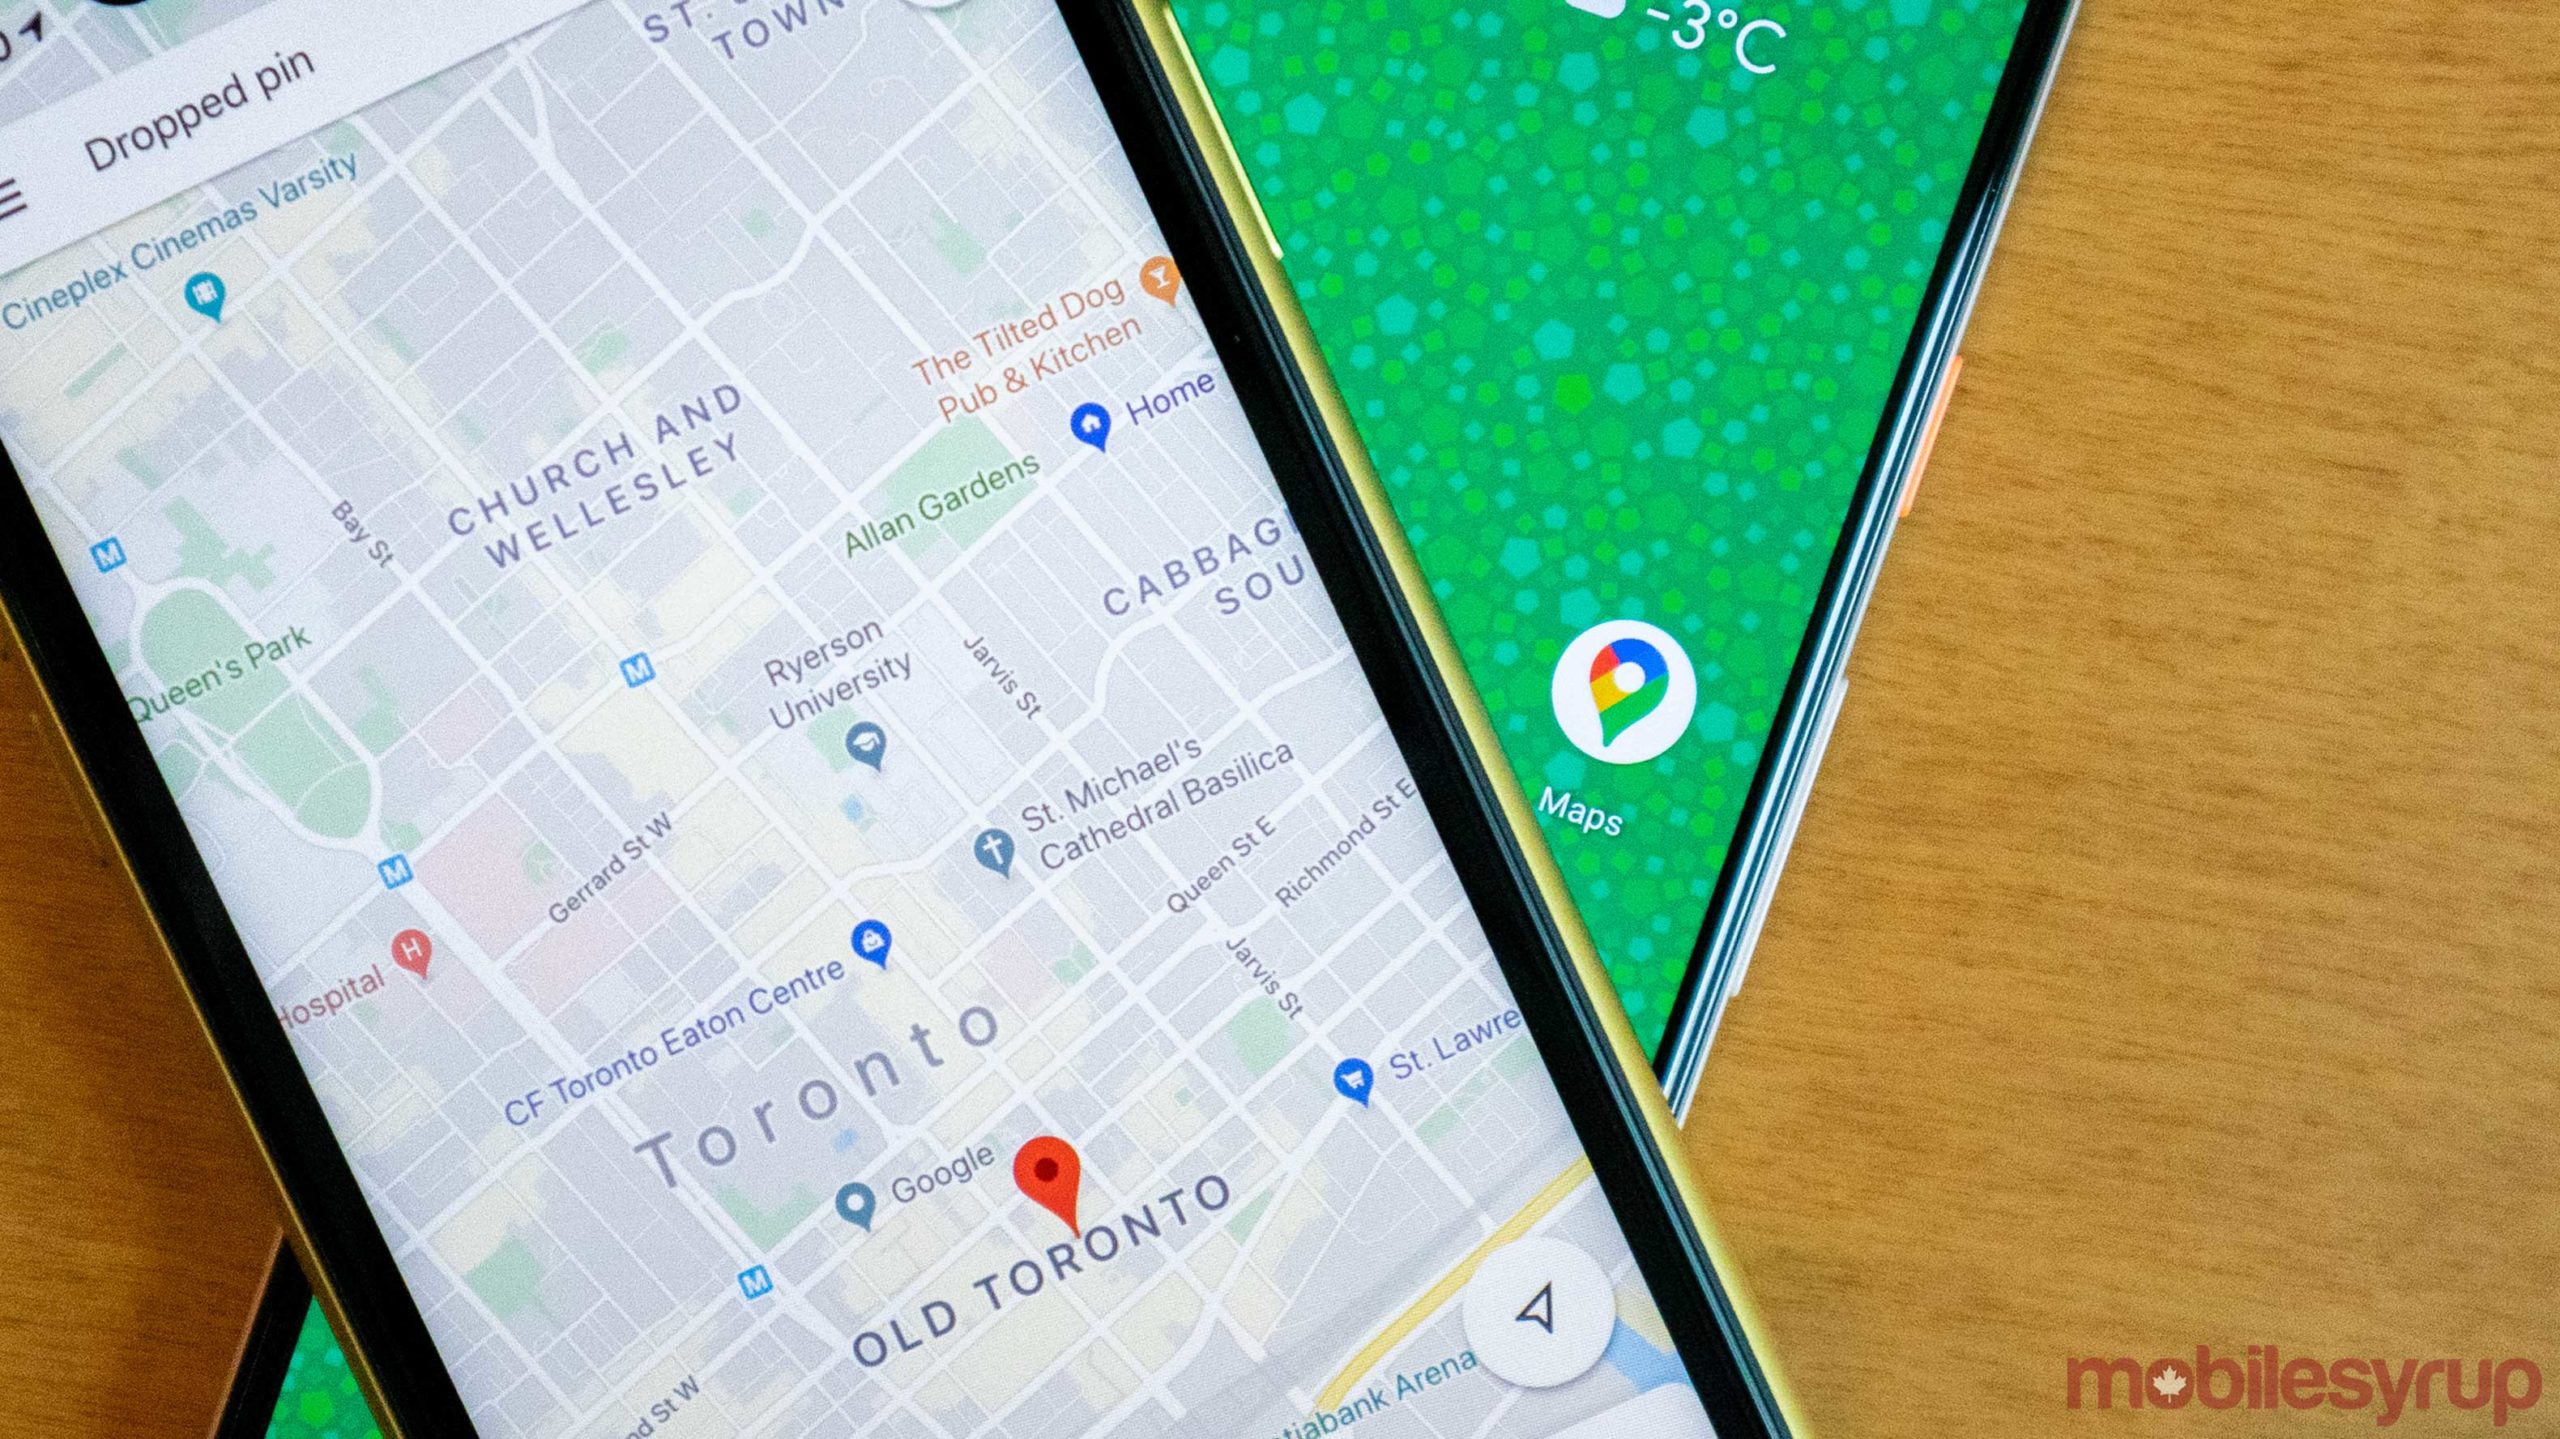
Google is reportedly working on a feature in Maps that would overlay areas of the world with COVID-19 outbreak data.
The feature was spotted by leaker Jane Manchun Wong, who posted screenshots on Twitter (@wongmjane). It appears the feature will be available from the ‘Map Details’ section. Users can access that section by tapping a white circle with a square overtop another square in the right corner of the map on mobile, although it’s worth noting the feature hasn’t rolled out yet.
Maps users can access other map options from this menu as well, such as Satellite and Terrain, and map details like Transport, Traffic and Street View.
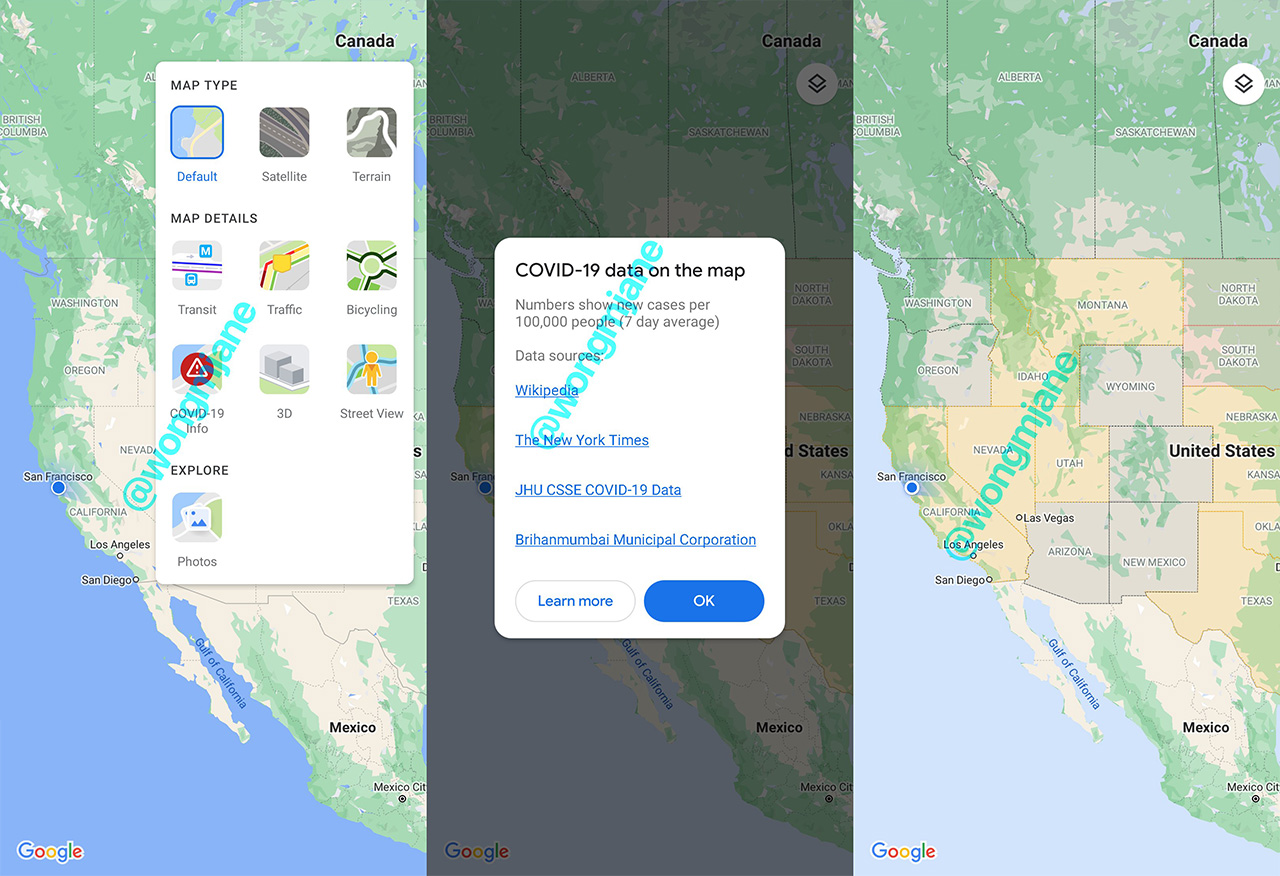
Wong discovered that when you enable the ‘COVID-19 Info’ feature in Maps, a pop-up explains the data and where it comes from. According to the pop-up, numbers shown over different areas show the seven-day average of new cases per 100,000 people. Maps sources the data from Wikipedia, The New York Times, Johns Hopkins University and Brihanmumbai Municipal Corporation.
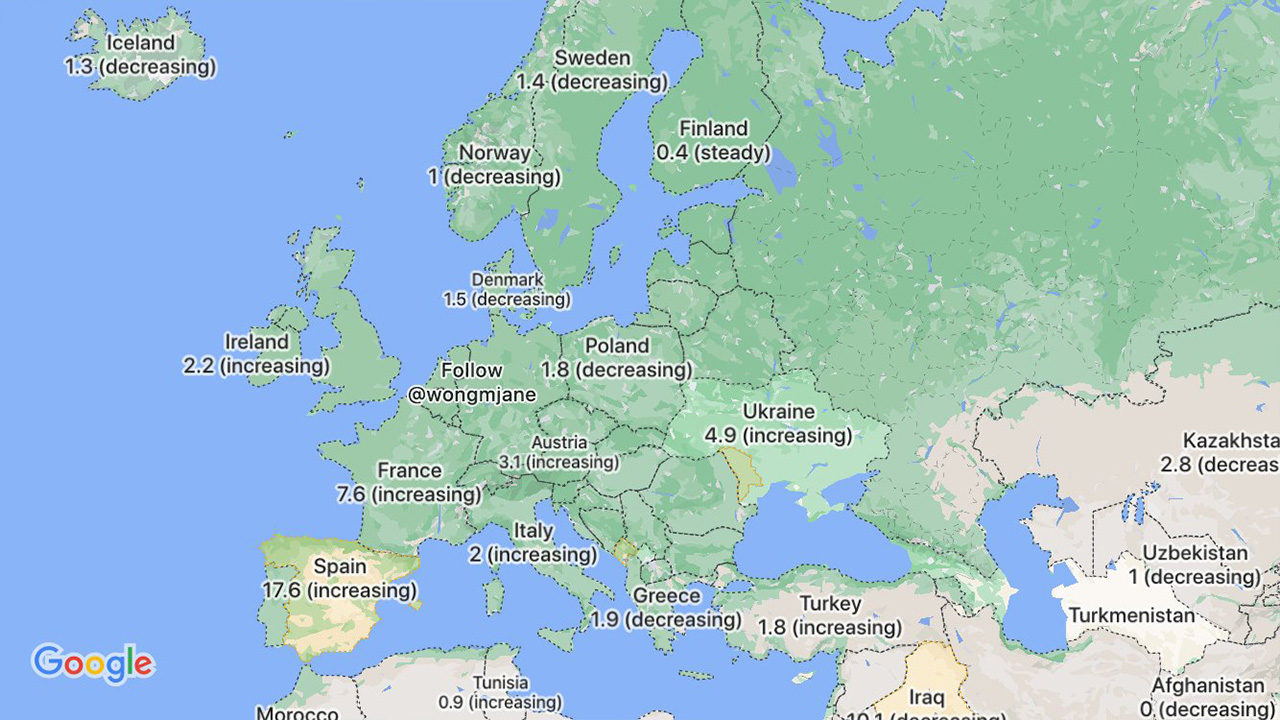
Along with showing the cases-per-100,000 people data, the COVID-19 Info overlay highlights areas with a colour and lists where cases are increasing or decreasing.
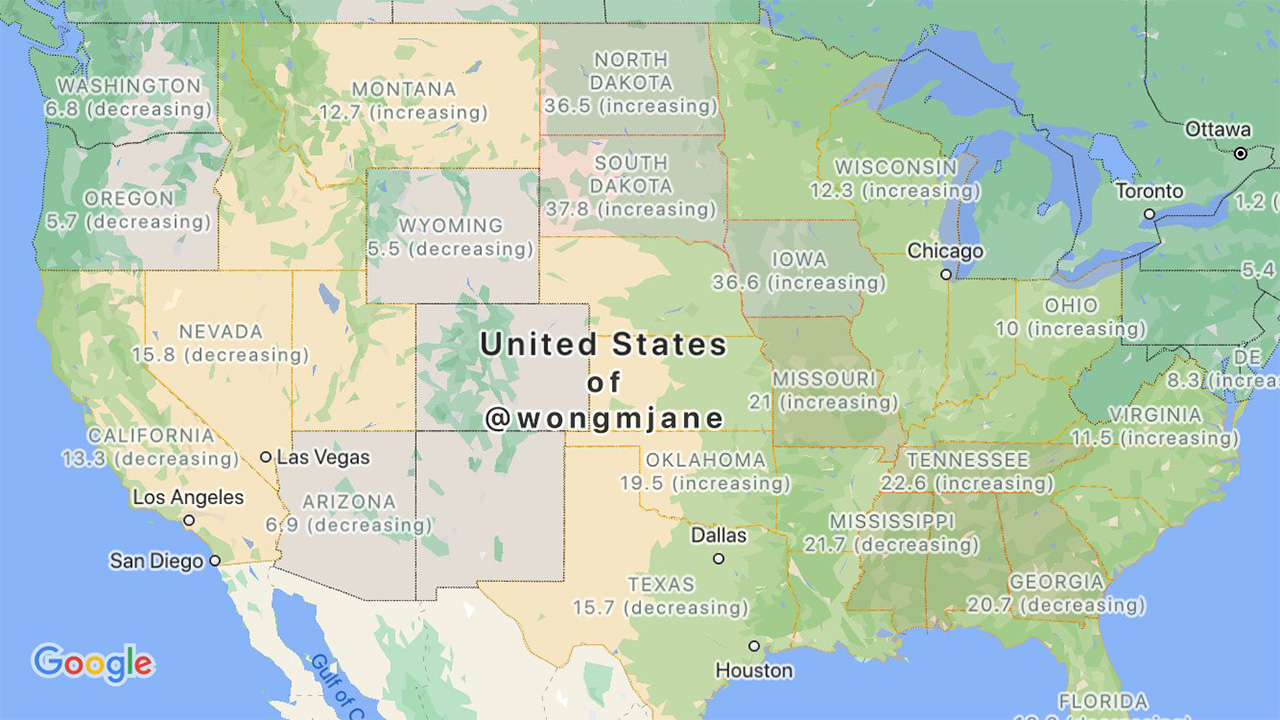
According to the screenshots shared by Wong, it appears the feature will work internationally, with the U.S. displaying cases at a state level. It’s not clear if other countries will also show state/province/territory level data as well.
It’s not clear if or when the COVID-19 Info feature will roll out in Google Maps, but if it does, it’ll likely be a helpful tool for anyone who has to travel. Of course, if possible, you should avoid travelling when possible, minimize contact with people and continue to wear a mask.
Source: Jane Manchun Wong Via: Android Police
MobileSyrup may earn a commission from purchases made via our links, which helps fund the journalism we provide free on our website. These links do not influence our editorial content. Support us here.