 The CRTC has release some incredible wireless statistics in their second annual Communications Monitoring Report. The data is based on 2008 number but is a great insight. Here is a few key takeaways (we have also posted the charts in our forum here):
– Our wireless footprint covers approximately 20% of Canada’s geographic area. However, it encompasses approximately 99% of Canadians.
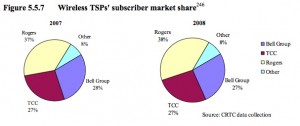
– Market share of the three largest wireless service providers (WSPs) did not change significantly in 2008 and continues to account for over 94% of the wireless market in Canada. Of the top three carriers, Rogers Wireless remained the dominant player with respect to the number of subscribers with a 38% market share, while the Bell Group and TCC each held 27%. The remaining 8% was shared among regional WSPs (MTS Allstream and SaskTel), small incumbent TSPs, and mobile virtual network operators (MVNOs).
– Mobile coverage did not expand significantly in 2008. However, the three major service providers have continued to upgrade their networks to third generation (3G)245 or 3G- equivalent capabilities to improve capacity, and to allow for faster data transmission speeds, and more reliable Internet connections. By the end of 2008, approximately 91% of Canadians were within the 3G wireless footprint.
– Wireless revenues, excluding paging, continued to increase from $9.3 billion in 2004 to $15.9 billion in 2008, representing an average annual growth rate of 14.3%. Similarly, there has been a continuous increase in the number of subscribers from 15.0 million in 2004 to 22.1 million in 2008, resulting in an average annual growth rate of 10.1%.
– Over 99% of Canadians had access to wireless services in 2008, of which approximately 74.3% of households subscribed to them. This puts Canada’s wireless penetration rates behind many of the OECD-member countries.239 Despite low penetration rates in Canada, the mobile wireless sector, excluding paging, had revenues of approximately $15.9 billion in 2008, a 10.5% increase over the previous year.
– The annual average revenue per user (ARPU) increased approximately 3% from $59 per month in 2007 to $60 per month in 2008. Data revenues grew at an annual rate of 35.2% in 2008.
More here at the CRTC


